


Discover our
Home for Learning
- Contact
- 412-624-8020
- [email protected]


Student teacher Matt Picklo clicks on his laptop and a new slide appears on the screen.
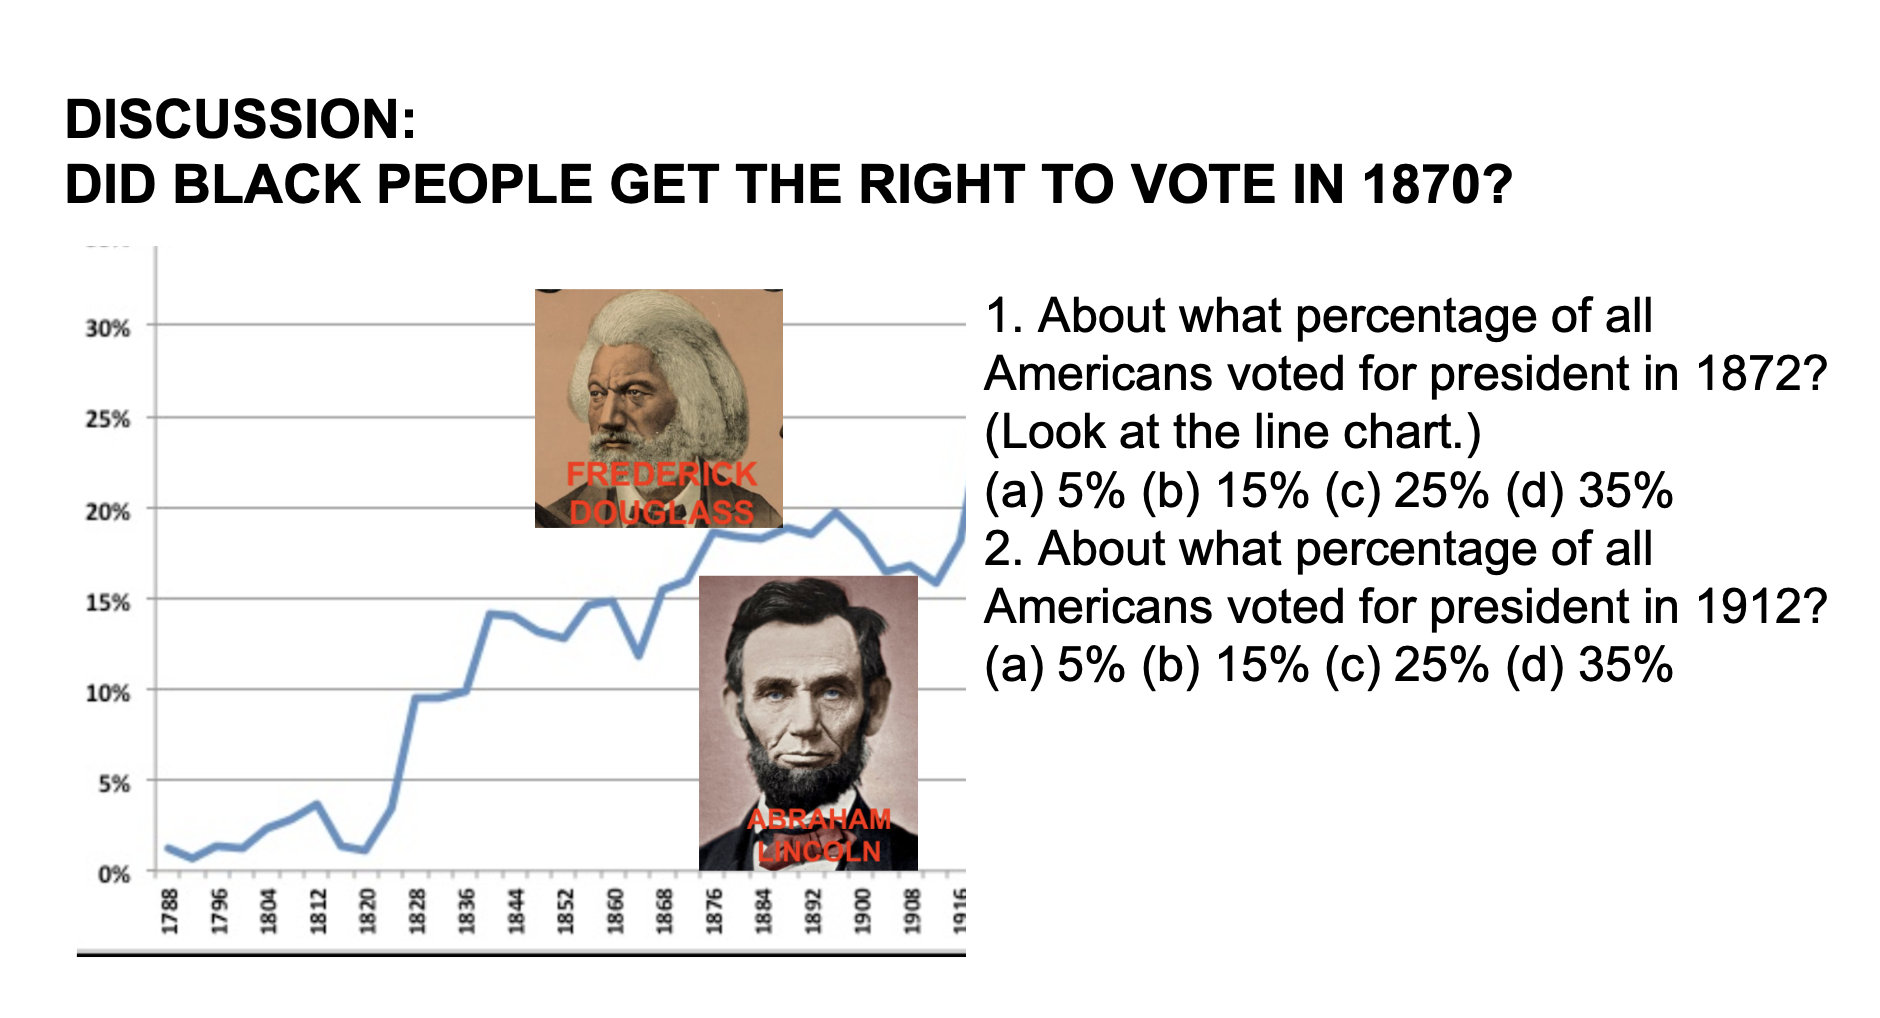
“What percentage of Americans voted for president in 1872?” asks Picklo, a student teacher in Greg Wittig’s U.S. History class. On the screen is a line graph depicting how many Americans voted in presidential elections from 1788 through 2012.
After a student offers the correct answer—15%—Picklo asks, “And what percentage voted for president in 1912?”
The answer is the same as in 1872: just 15% of all Americans.

How could this be, Picklo prompts the students, when Black Americans were given the right to vote in 1870? Why isn’t there more of an increase?
The answer is complicated, touching on issues of equity and discrimination and introducing these Falk seventh-graders to phenomena such as poll taxes, literacy tests, and the focus of today’s lesson, gerrymandering.
It’s all part of a curriculum developed by Nancy Pfenning, a retired University of Pittsburgh statistics professor. She initially developed the lessons as part of an ongoing relationship with KIPP NYC charter schools and Computer Science education faculty at Brown University, but approached Wittig about a collaboration.
“We’ve fit it into the curriculum in a really cool and important way,” Wittig says. He and Picklo have blended Pfenning’s 10 lessons with the work Wittig is doing incorporating American history into current events.
The partnership is a win-win, enriching the material Picklo and Wittig are presenting their students. For Pfenning, presenting the curriculum to Falk students offers her a chance to see how the lessons are received and to make necessary adjustments to strengthen the lessons. As Picklo advances to the next slide, she’s seated at a desk near the back of the room, listening and taking notes.
“Normally I don’t have this luxury,” Pfenning says. After completing the curricula, she shares the materials with her colleagues at KIPP and Brown, and ultimately travels to New York to help train teachers. Then, several months later, she visits again to sit in on a class and observe how students are responding.
Braiding Data and Content
Pfenning’s work with KIPP is aimed at providing students with a firm grounding in statistical literacy by integrating data and statistics smoothly and meaningfully into lesson plans. The idea is to use data and its representations as a way to support the content of a lesson, rather than as the content itself.
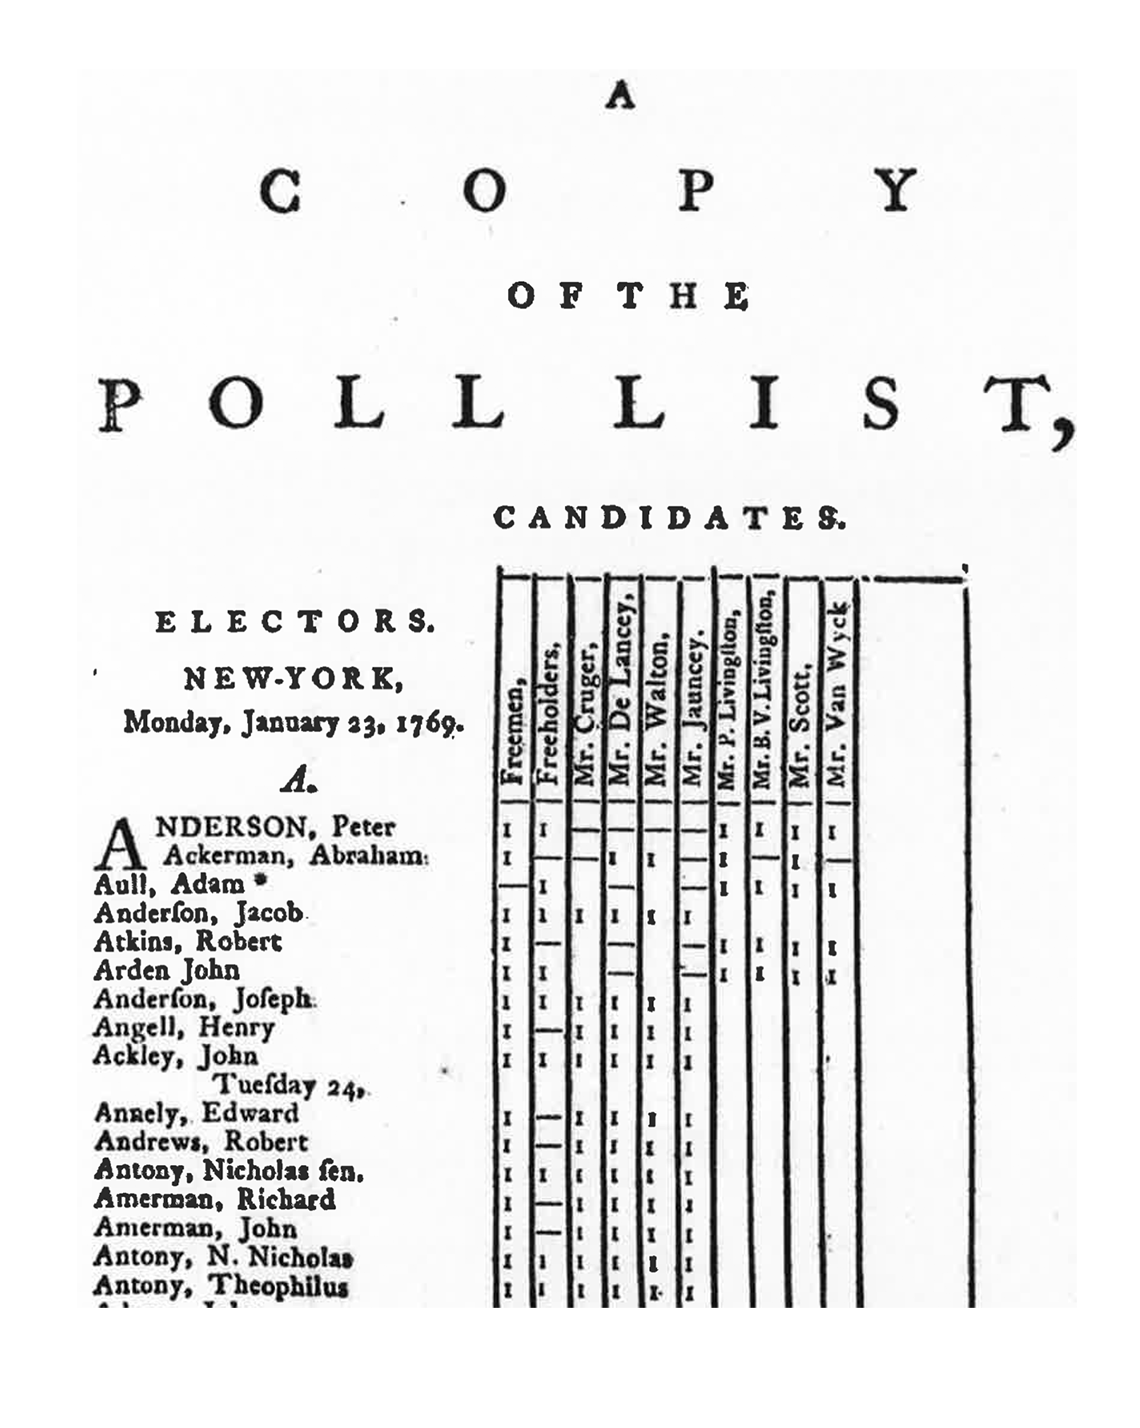
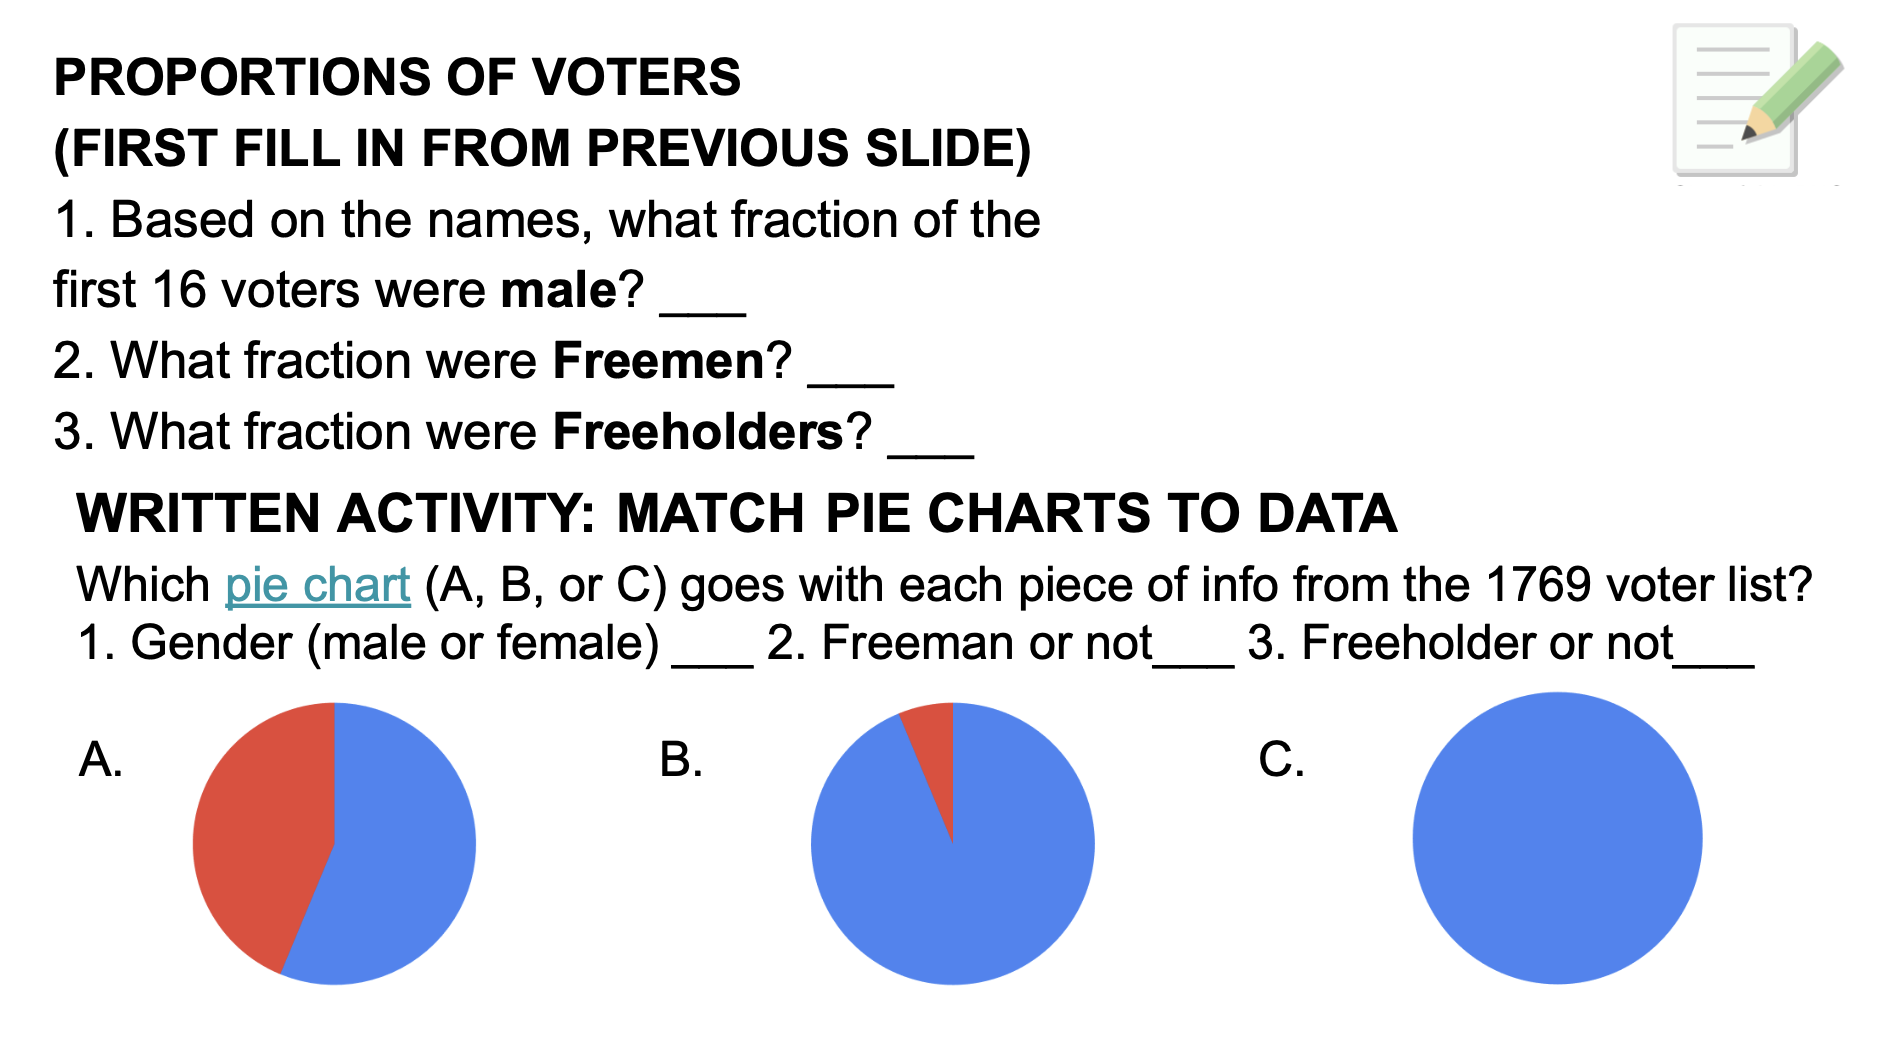
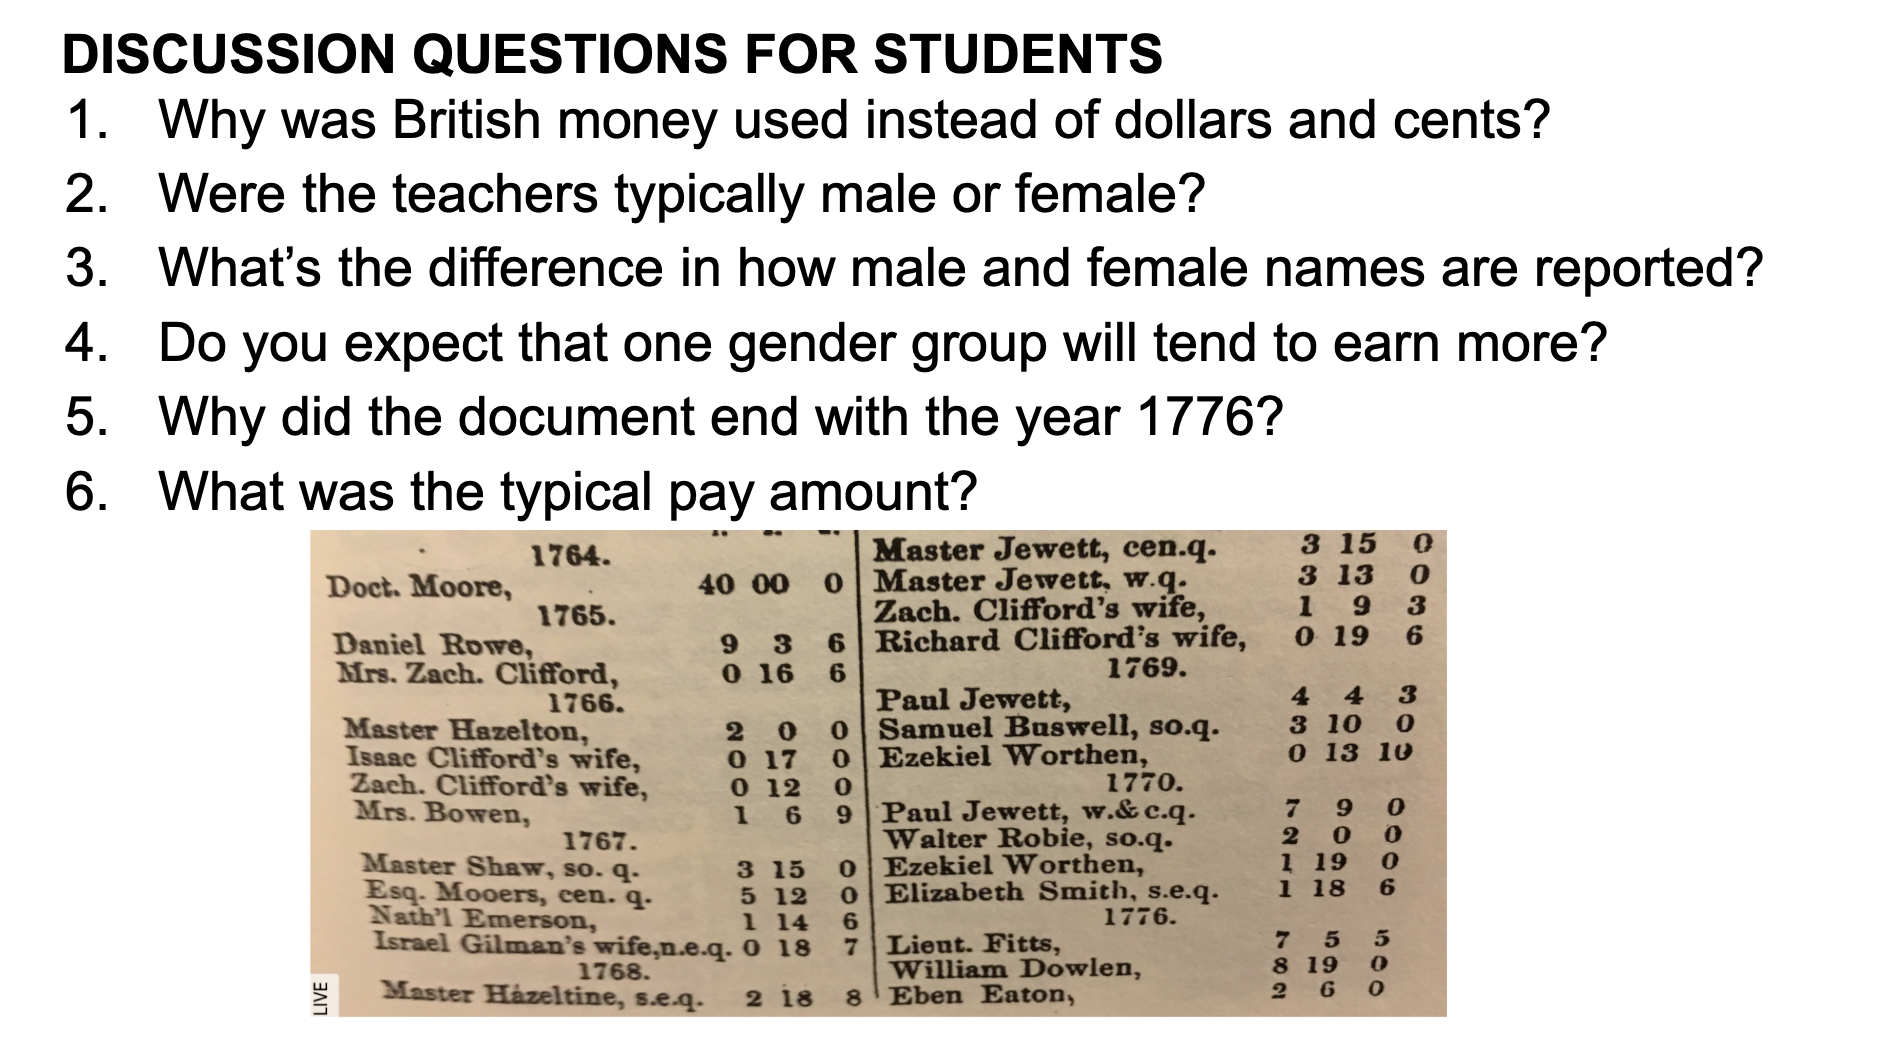
Each of the unit’s lessons demonstrates how data can be interwoven seamlessly into a compelling story. The visualizations of data that Pfenning has used range from simple pie charts to more complicated scatter plots, and she’s also included many primary-source documents, such as a table showing the salaries of colonial schoolteachers.
The representations of data that Pfenning selects amplify her points, underscoring important pieces of information in ways that text cannot. There’s an art to selecting the right piece of data to represent, as well as choosing the proper way to present it.
Working with Wittig at the start of the semester helped Pfenning refine the ways that data complements and supports the information contained in these lessons.
“Greg’s had some great ideas,” she says. “He wanted to include examples of charts that are not appropriate for a given data set and have students tell us why.”
Wittig used what he knew of his students to offer that adjustment.
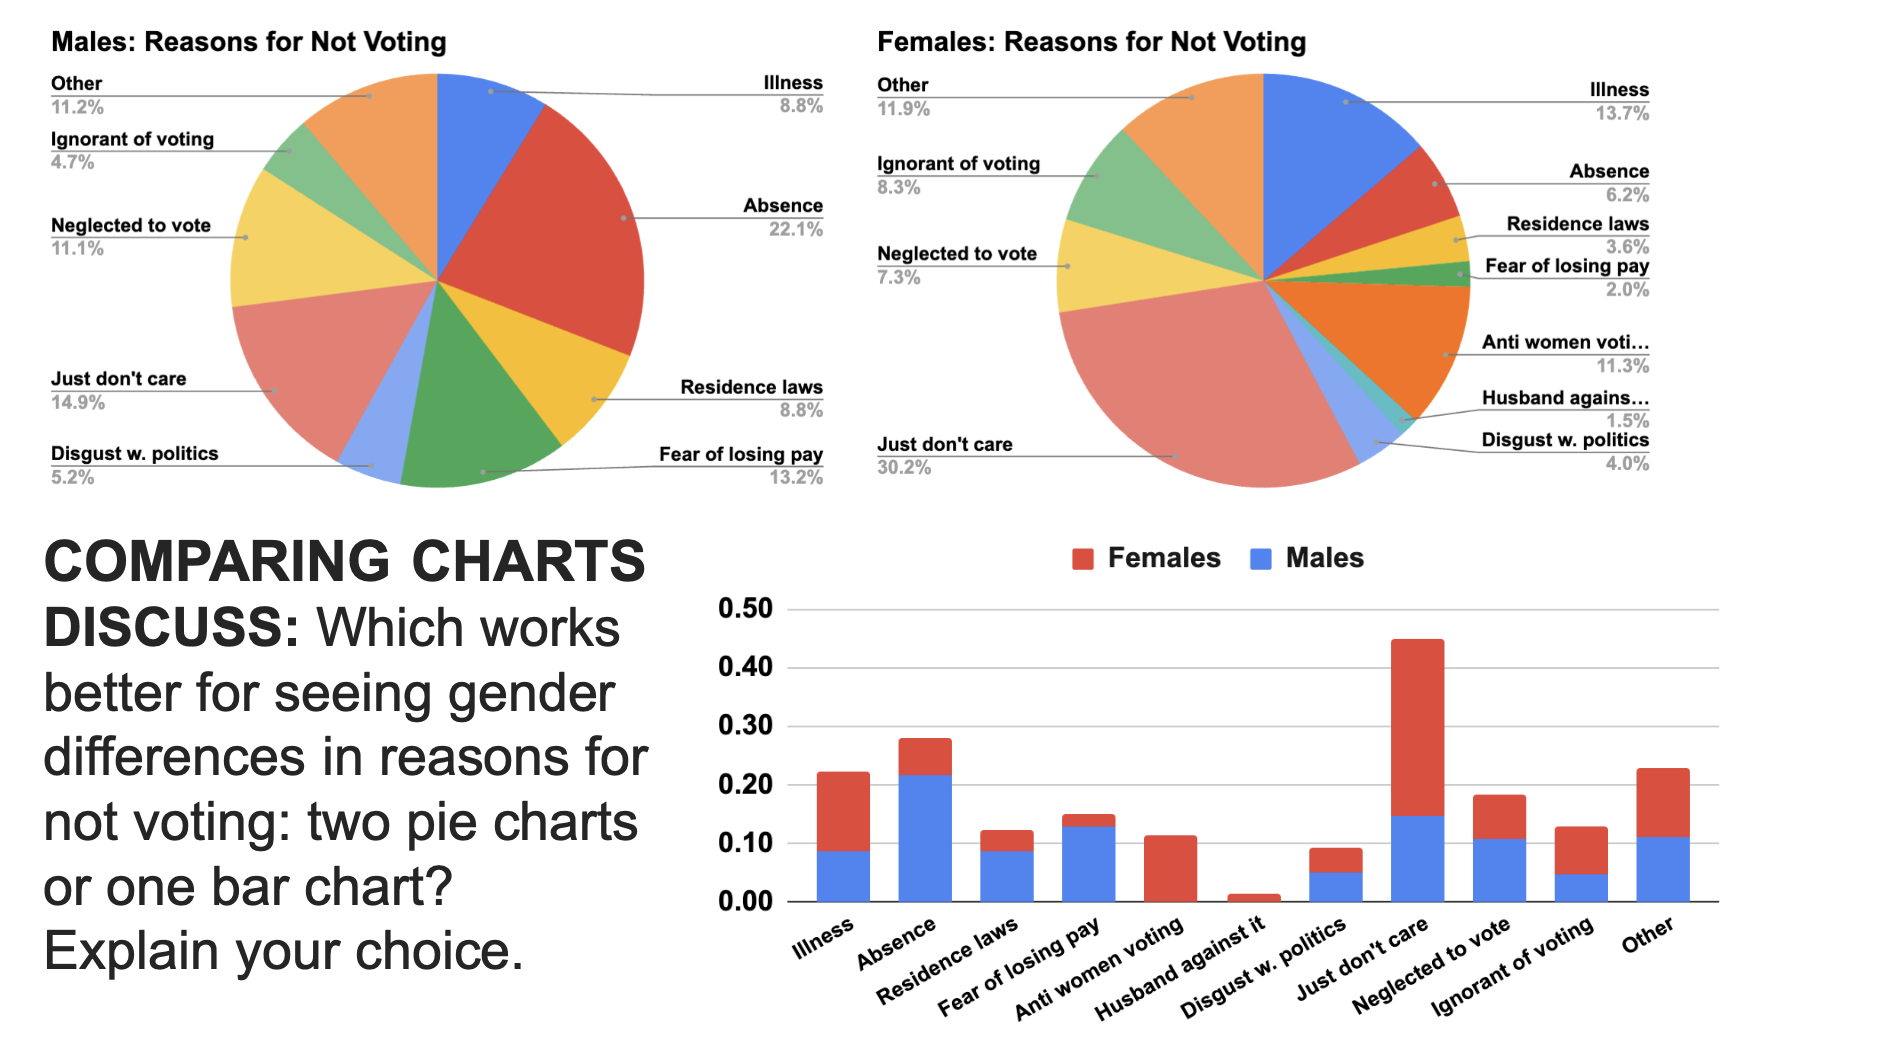
“We suggested that instead of just giving the right answer, we give all the possible wrong answers and why they’re wrong,” Wittig says. “It’s a way of discriminating between different ways of expressing information and finding which would be the best.”
The idea is to get students thinking more explicitly about why one method of presenting some data, such as a histogram, might present a clearer picture than a pie chart, for example.
“I did that and saw that students were picking up on what might be lost when you have either too much or too little information,” Pfenning says.
Using data in this way—much the same way that a historian might use it—makes the lessons more powerful, Wittig says.
“Any time you can teach a skill in the context of how it will be used, it’s always more effective.”
Scaffolding for Teachers
Having Pfenning’s curriculum to follow and to build upon has been helpful to student teacher Matt Picklo, currently finishing his Masters of Teaching degree from the University of Pittsburgh’s School of Education.
“It allowed some room to try out different discussions and different questions to ask,” he says. “Each section we taught the lesson to engaged in a different way.”
Teaching the gerrymandering lesson to different sections, for example, Picklo was able to try a few different ways of engaging students. In one class, students used rolls of crepe paper to divide the class into sections, just as gerrymandering cordons geographical areas into voting districts. Another section instead drew districts on the board.
“You have to read the classroom and see how students are interacting with the material,” Picklo says, in order to determine how best to implement a lesson. “There’s room for trying out different things while keeping the same structure.”
In addition to the slides that Picklo is presenting to the class, Pfenning has created supplementary teaching resources such as a workbook that students are following along in, answering the questions that pop up every few slides.
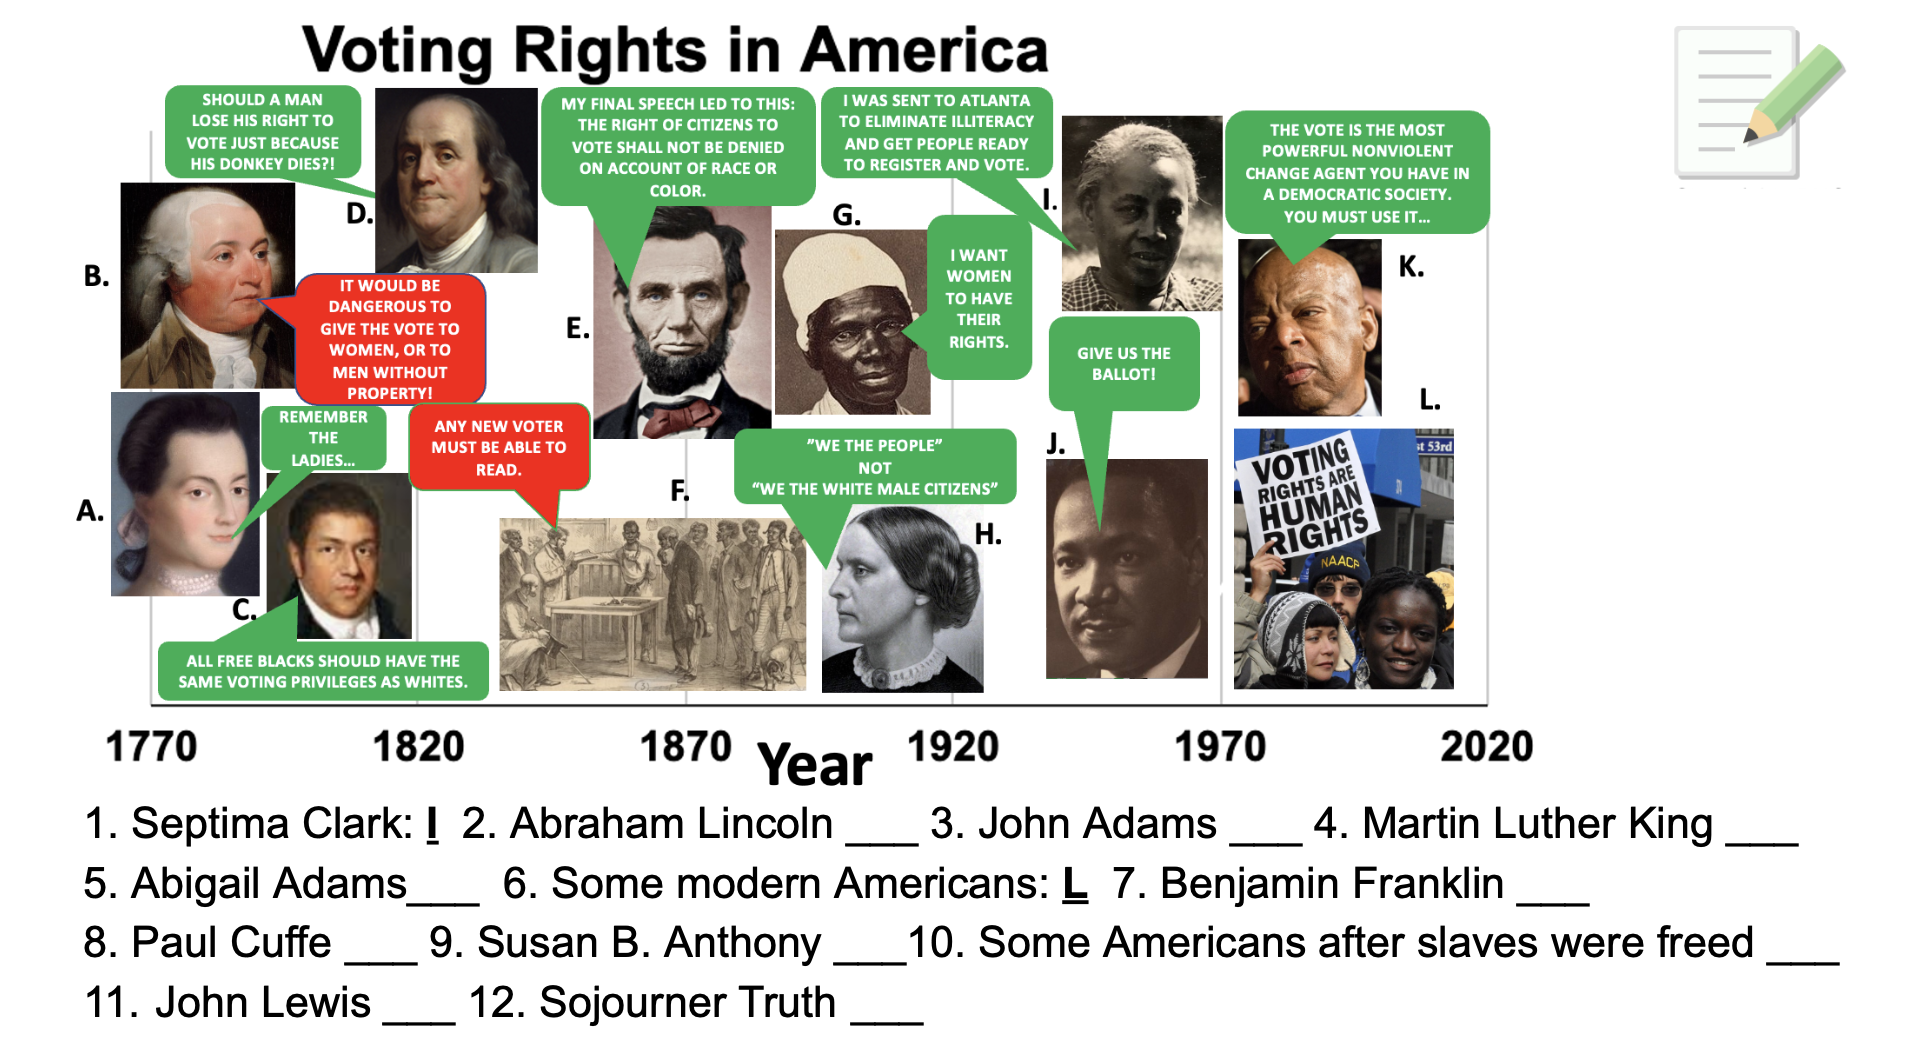
To bolster students’ understanding, they created posters around topics ranging from gerrymandering and the electoral college to the role that race and gender played in voting across American history.
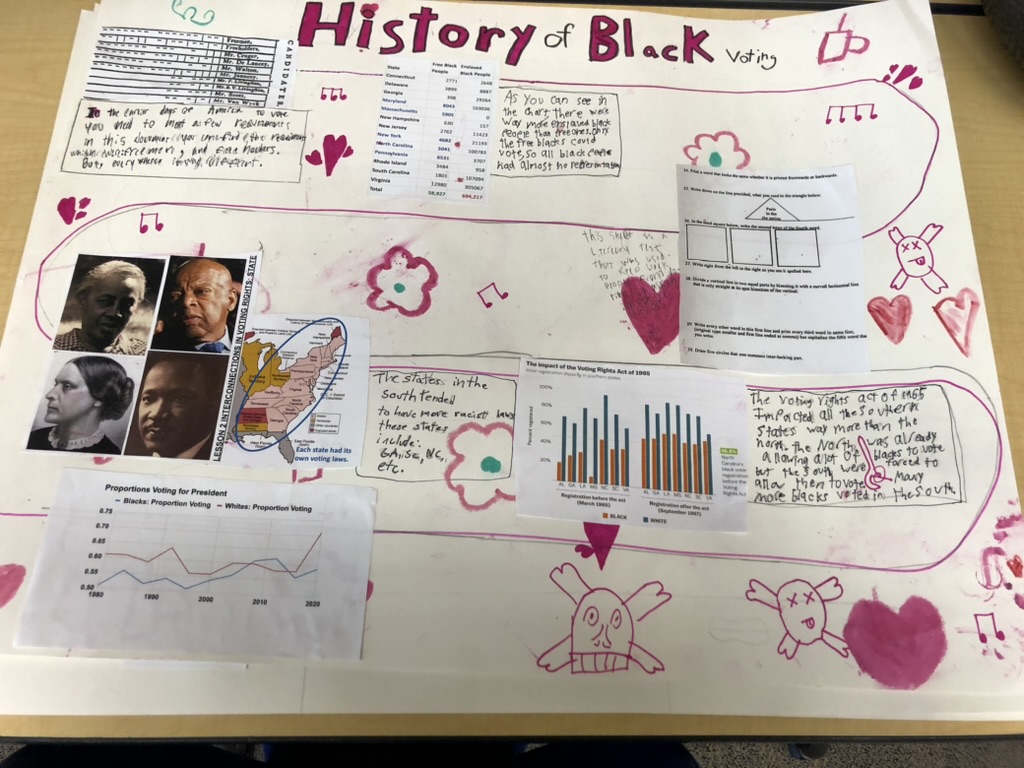
“The students did a fabulous job of creating, illustrating, and annotating a brief narrative of their chosen topic,” says Pfenning, “including a judicious number of relevant statistical charts that they clearly understood in the context of voting inequities.”
The Plural of “Anecdote”
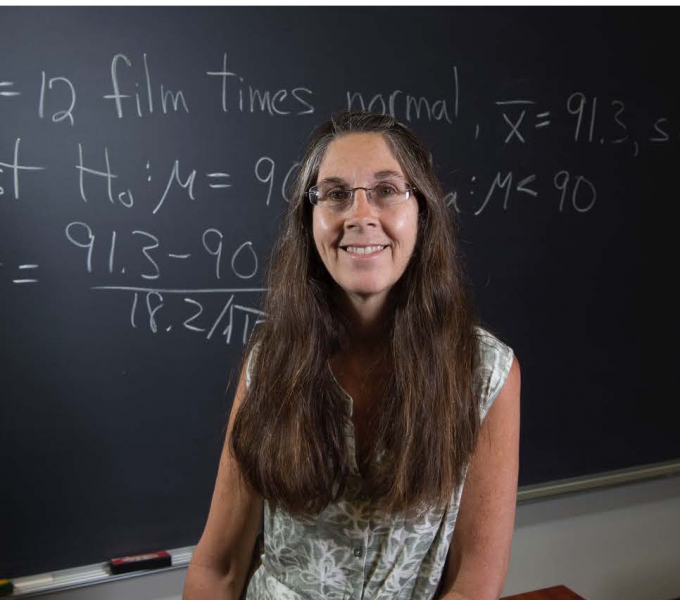
Pfenning earned a PhD in mathematics from Carnegie Mellon University and taught at the University of Pittsburgh. She expected to teach calculus at Pitt, but found that the department needed someone to teach statistics.
“I realized that teaching stats can be much more fulfilling than teaching calc because there’s such a vast number of real-life applications,” she says. “With statistics you can get into meaningful examples in all walks of life that help you to reach students’ interests.”
After a rich career teaching statistics—Pfenning even wrote a textbook, Elementary Statistics: Looking at the Big Picture—she retired. It was then that Pfenning developed an honors course called “Patients in Literature’s Pages” that drew on sources such as short stories to gain a deeper understanding of medical conditions.
“I always taught students that it’s wrong to say the plural of anecdote is data,” she says, but in the course both she and the students found that anecdotal evidence was an extremely effective way to learn more deeply about the medical conditions explored in the course.
She credits that experience with paving the way toward her current work creating curricula for KIPP.
“It shouldn’t just be about a data set about the whole country,” she says. “It’s important to intersperse data with primary sources and remind students that the voters we’re summarizing were real people.”
A Repeat Collaboration
Her work in Wittig’s classroom is actually Pfenning’s second collaboration with a Falk Middle School teacher. Last year, she worked with science teacher Alex Dragon on a sixth-grade unit related to radio-carbon dating that culminated in a class field trip to Meadowcroft Rock Shelter. Like the voting unit, the curriculum incorporated representations of data into a cohesive narrative to teach both content and data literacy.
That unit was created for Meadowcroft after Pfenning met the site’s director, who wondered how to teach students about radio-carbon dating. She read dozens of research papers about all sorts of archaeological evidence from the site and divided the evidence about Paleo-Indian occupation of the shelter into a series of topics.
“Rather than doing a chronology, let’s look at what you learn from modified bone artifacts,” she says. “Or let’s look at ceramics, or see what you find from evidence of trees and other plants.”
Notably, she was able to sequence the data representations she used in the Meadowcroft materials so that the students were learning increasingly sophisticated concepts as the unit went on. It’s a method she also employed in preparing the voting lessons in Wittig’s classroom.
Echoes
Picklo clicks to advance to the next slide, which introduces the subject of poll taxes and literacy tests. There are audible protests from the students as Picklo describes how a Black voter might be denied the right to vote for missing just one question on a test.
“That’s the one that bothers them the most,” says Pfenning, recounting another student who rose from his seat to approach the whiteboard and point at the slide in righteous indignation. “As test takers, they’re putting themselves in the position of those voters.”
Picklo and Wittig note that the lessons learned during Pfenning’s voting unit have echoed in their other lessons this term.
In a unit focused on the United States’ founding documents, for example, Picklo points out that students have drawn connections between the voting unit and the fact that many of these documents, such as the Constitution, had inequality built into them from the moment they were written.
“A lot of the later amendments to the Constitution are talked about in the voting unit,” Picklo adds. When he and Wittig cover the 15th or 19th amendments, for example, students are already familiar from having talked about these amendments, which gave Blacks and women, respectively, the right to vote.
The Beauty of Being in a Lab School
“It’s always exciting to work with other people on a curriculum,” says Wittig. “That’s the beauty of being in a laboratory school.”
The students appreciated knowing that they were playing a role in testing out Pfenning’s curriculum, Picklo says.
“They have a say in whether it’s going to work and how it will change.”
Now that he has this curriculum, says Wittig, “We can use it and develop it in any way that fits.”
He’s already thinking about how to integrate the voting unit into his teaching next year, when the presidential election will dominate the media landscape. Much of that talk will surely resonate for students steeped in lessons about who is allowed to vote, who isn’t, and the means used to keep some groups from participating.
“Students now have knowledge of gerrymandering and how the electoral college works,” adds Picklo, “and they’ll see all of that in play in the election.”
Thinking beyond the 2024 election, Wittig is also looking forward to eventually teaching seventh-grade history to Pfenning’s granddaughter, Lillie, who is now a Falk first-grader.
“Having witnessed first-hand the extraordinary degree to which Falk fosters the intellectual growth of students like Lillie,” says Pfenning, “I knew we could set a high bar for these Middle School units. Sitting in on the classes, I saw teachers guide their students to internalize concepts that many people would consider challenging even at the university level.”